Stay true to your Form

In my most recent post I showed what happened when you make a change in one of the answer options in a choice question in Forms. That case was based on a real-life scenario.

You will know by now that these things trigger my curiosity, so I decided to find out what happens to other question types when you change them halfway?

I thought about question types that can be changed significantly and came up with Text, Rating, Ranking and Likert.
So I started out with this questionnaire:

The survey start – 4 changeable questions

And after entering 10 responses randomly, this was the first result:

Results 1

With a score of 4.20 this must be a good blog post! 🙂

Then I made the first set of changes:

  • In the Text question, I changed from short text to long answer
  • In the Rating question, I changed the 5 stars to 5 numbers
  • In the Ranking question, I replaced “Darts” with “Figure-skating”
  • In the Likert question, I changed “Forms” to “Visio”

Again, I added 5 random responses, and ended up with these results:

Results 2

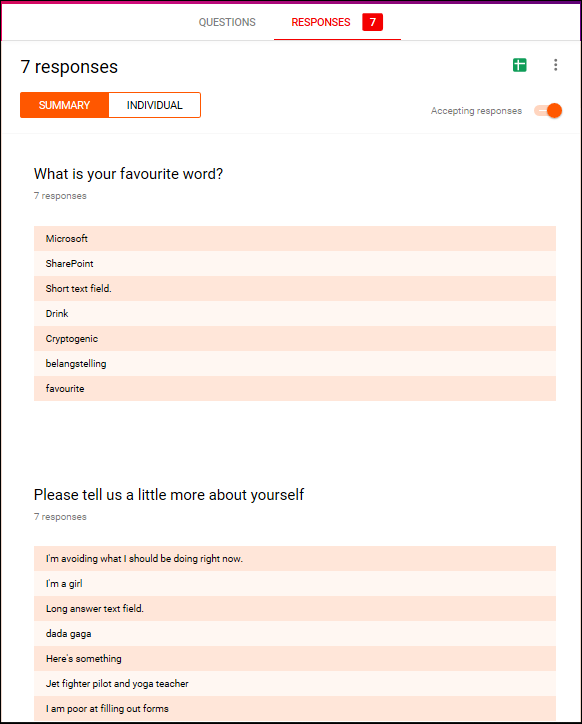
Results after the first change

You only see the last 3 responses for the Text question, the answers appear a bit more wordy. The word cloud is a bit fuller, but that’s it.

Exchanging stars in the Rating question does not make much difference, you get a number rather than stars, but that is not significantly different.

For the Ranking, the change is rather more alarming as the results for Darts are replaced by those for Figure skating, and the name Darts completely disappears. I had expected that the results would be separated, and that Darts would be called “Other”, like with the choice options, but apparently not.

For the Likert question, again all votes for Forms are now turned into votes for Visio, and the word Visio has disappeared, there’s no “Other” like in the choice question.

So, it was time to make some more changes:

  • In the Text question, I changed to a Number
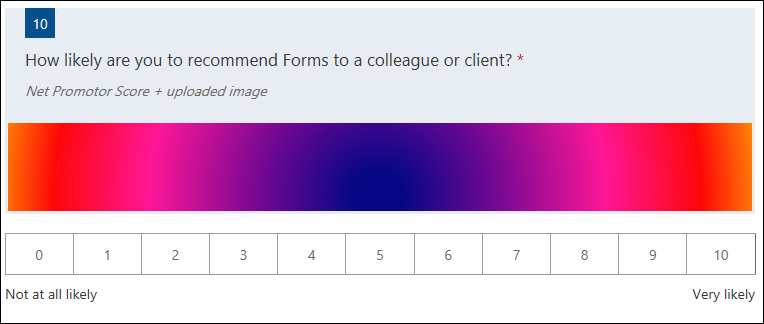
  • In the Rating question, I changed the 5 numbers to 10 numbers
  • In the Ranking question, I added “Cycling” as an option
  • In the Likert question, I added an option “N.A. or don’t know”

And when I had added 5 responses, the results looked like this:

Results 3

Results after the second change

The Text question now shows the last 3 numbers PLUS the old word cloud. Most confusing!

For the Rating question, the average was 4.9. I had made several entries in the 6-10 region, but as there were at least15 entries with a lower number, the average had not increased that much.
But…when you have a 5-point scale and score a 4.2 (as in the second result) you are doing very well. If you have a 10-point scale, 4.9 is pretty low.

For the Ranking question, the new sports gets added to the results. There’s only 5 responses for this option, which skews the results. 20% firsts for this sport is not as many as 20% for the sports that have been there for the entire ride. 🙂

For the Likert question, a change of colour may confuse you. The “Yes” option was blue, but has turned to grey. This makes perfect sense from a visual design perspective, but is a bit confusing otherwise. Again, as with the Ranking, there’s only max. 5 responses of “N.A. or don’t know” possible, compared to max. 20 for the other options, so this will skew results.

I also looked at the Excel.

The detailed results in Excel

The Text results are a mess. Yes, you could score all answers as a number, but then you might have as well sent an email or interviewed everyone.

You see that the first 15 Rating scale answers are not multiplied by 2 after moving from a 5-point scale to a 10-point scale. This will result in a much lower score than you would have had if you had started out with a 10-point scale straight away. This will lead to the wrong conclusion: that people do not like this blog topic, while in fact they do!

For the Ranking, you see that the word “Darts” no longer appears in the responses, it gets overwritten after the change. So that darts fan is now suddenly a lover of figure skating. 🤦‍♂️ It also means that cycling fans will hardly ever be in the majority as that option was added quite late in the process.

For the Likert question, the results between the options are not comparable. Everyone who thought they were answering a question about Forms, have now answered the question for Visio. And “N.A. or Don’t know” may have scored differently when the option had been there throughout the survey.

I could have made more changes, but I trust you will get the gist.

Conclusions

  1. Mid-survey changes are technically very easy to do.
  2. Mid-survey changes are not visible as they are not logged (not even in the Excel file). This will make it very hard to interpret the results. It will even be difficult for the owner, as they do not know at exactly which moment between entries the change has been made (except when adding an extra option).
  3. The good news is, that for Rating scale and Likert questions you can easily correct a typo. In the Choice question types even that creates a new option, as we have seen before.
  4. Mid-survey changes can create havoc in the results. In fact, you are changing the rules in the middle of the game. Results become incomparable or and conclusions may be completely incorrect (such as changing Rating from a 5- to a 10-point scale).
  5. You may want to check the Excel for the exact results, but that does not help when drawing conclusions. Are you sure that someone who likes to watch Formula 1, would have the same preference when (s)he would have had the option to select Cycling?

This will not come as a surprise, of course. I only hope I have made things more clear by having shown what happens exactly when you make a change. It is tempting as it may look like a small and easy change, but it can have unpleasant consequences.

As mentioned in my earlier post, I would rather suggest that before launching your survey, you

  • discuss the setup of your survey with your colleagues – e.g. which sports do they want included in the answer options?
  • ask one or more colleagues to complete the survey to see if they understand your questions and the answer options are logical, complete and spelled correctly
  • remove all test entries or copy your survey before it goes live
  • resist any push to make changes when the survey is running, even if it comes from higher management. Show them this blog when they insist. 🙂

Do you have any experiences with making mid-survey changes?

Funny Forms response

Recently a colleague saw something strange in the Forms survey she was running: she had 5 potential answers, but the results showed 6, including one “Other”. What had happened here?

Let me show you with some screenshots.

I created a survey. By the way, does anyone know the mechanism of that lightning symbol that sometimes shows up at the Theme-button, providing you with a number of additional images? Sometimes it is there, sometimes it is not. Most confusing!

So, this is the Form I created.

The form, 5 answer options, shown randomly

I added some results until it looked like this:

The results so far

Then I did something and then the results showed 6 answer options, including “Other”. It also changed to a bar graph instead of a pie.

Suddenly an extra option appears

Do you notice what I did? I changed “Text message” into “Text”. This means that my earlier entry is a different entry than the current choice options, so it is “Other”.

Any new entries after the change will be added to the new option:

New entries will be added to the new option

Conclusion

If you see an unexpected “Other” option in your survey responses, remember if you have changed one or more of the options during the survey.

How to remediate?

You can go back to “Text message” but if your survey is already live, you may have received entries with “Text” in the mean time and that will mean that those will now be in “Other”, so that does not really help.

Entries with the new option will be “Other” when you change back to the original wording

Fortunately, the Excel file will give you the exact responses, old and new.

Old and new responses

How to prevent?

Of course, prevention is better than fixing, so I always advise my colleagues to:

1. Ask colleagues to review before going live

Ask one or two others to review any survey before it is made live. A fresh pair of eyes can help a great deal in removing any overlooked typos, weird questions or answer options, or formatting mistakes. Additionally, Forms mentions the average time to complete the survey, and this may help you to “sell” participation – “it only takes 2 minutes”.

2. Remove any test data before going live

Have you or your reviewers completed the survey while checking? Make sure you remove these responses before you go live, especially when you have corrected anything during the review. This way you will start with a fresh survey.

Hope this is helpful!

3 ways to share a Form with colleagues

We are using Forms for almost everything these days. We have used it to sign up for webinars, to register who enters the building, to request research and that is outside the “formal” use as a way to get people’s opinion.

As Forms is a personal tool, all Forms you create are by default for your eyes only. You are the only one who can adjust your Form and can view the responses. Moreover, when you leave the organization, your Forms are deleted. And while your Form appears to be a sort of document (it appears in your All files on your Microsoft365 start page), it does not live in your OneDrive nor SharePoint so your manager can not save it when you leave.

Fortunately, there are a few options to share Forms with others (in or outside your organization).

1. Just the responses

If you would like your colleagues to view results, you can share the responses page with them.

  • Click on the Responses tab and then the … on the right
  • Click “Create a summary link” from the popup
  • Share the resulting link with the person(s) you would like to share with.
How to give your colleagues insight in the responses

The people you share the link with will only see the response page, and can not see anything more, such as all results or individual results. In case you have asked text- or date-questions, they will only see the 3 latest responses.

Colleagues will only see responses and nothing more.
This is what you see if you are the owner of the Form – you have many extra options.

So, this can be useful if you want to share preliminary results with your colleague or team. They can watch progress and get an idea of the responses. But they will only get the complete picture when you share the final results with them.

2. Share the Form to collaborate

My colleague and I organize webinars, and one of us creates the Form to sign up and then shares it with the other. We can both adjust the texts, questions and settings, which allows us to make modifications where needed, e.g. add a warning that a certain webinar is fully booked, share the link or close the Form when we are at the end of a series.
Additionally, we can both see all the results, and export them to Excel, so we can both see who we need to invite for each webinar.
This is useful when your Form is part of a team project, or when the Owner is busy or on a longer leave during the run.

The Form will still be deleted once the Owner leaves the organization and their account is deleted. If the Form needs to run after their departure, the new owner will have to make sure to download the Excel, make a copy or use the template (see option 3), and share the link to the copy before the original Form is removed.

How do you share to collaborate?

  • Click the Share button, and in the popup go to “Share to collaborate”
  • Click “Get a link to view and edit”
  • Select the option on the bottom: “Specific people in my organization can view and edit” (assuming you do not want the whole world to be able to edit your survey)
  • Start typing the name of the person(s) or Group you want to share the Form with, and click on the correct suggestion
  • If it is urgent, copy the link and share it with your colleague(s), but the Form will show up on their Forms page anyway under “Shared with me”.
This is the place to be when you want to share a Form to collaborate
Enter the name and click on the correct suggestion.

3. Share as a template

If you have created a nice Form, and someone else wants to use it for their own purposes, you can share your Form as a template. They will then create one or more stand-alone copies of your Form. I often use this when creating a “solution” for a specific question. In that case I create the Form and after testing and approval from the requester, I share it as a template. They are then free to do with the Form whatever they want.

  • Click the “Share” button, and in the popup go to “Share as a template”
  • Click “Get a link to duplicate”
  • Share the resulting link with the people you want to share it with – these can also be outside of your organization
How to share your Form as a template – this will create a stand-alone copy

The receiver clicks on the link and sees the Form with a text on top: “Duplicate this form to use as your own”. If they then click “Duplicate it” they will have a copy of the Form. The word “Copy” is added to title, but the new owner can remove that easily.

The new owner of the Form will get this message – easy-peasy!

Stop sharing

As far as I know, you can not stop sharing the response page or the template, but you can stop the sharing to collaborate.

  • Click the “Share” button
  • Click the arrow to the right of the people that have access
  • In the next pane, hover over the person or group to be removed and click the trash can symbol
You can easily see who has access, and manage access from here as well
Just click on the trash can symbol to remove access

What type of link did I receive?

You can see from the first part of the link what your colleague shared with you:

  1. The responses page: https://forms.office.com/Pages/AnalysisPage.aspx
  2. The link to collaborate: https://forms.office.com/Pages/DesignPage.aspx
  3. The template: https://forms.office.com/Pages/ShareFormPage.aspx

Thoughts?

Do you often share your Forms or do you mostly keep them to yourself? If you share, what do you use most often?

Forms is fantastic!

I wrote about the Quick Poll (Email + Form combi) a few weeks ago, but there’s more to say about Forms!

Net Promotor Score (NPS)

The other day I showed the Net Promoter Score question during a Forms webinar, told my audience how it worked and that “I honestly do not know if it is very useful” (as I hate it when I get an NPS question myself and I think I am not alone).

Immediately three people jumped in to say that it was very useful for student and intern evaluations and based on scientific evidence and that it has great predictive value. They were very interested in the results and were impressed with the fact that the calculation is built-in in Forms so you get the score without having to do any work.

So, from now on I will treat the NPS question option with a little more respect! 🙂

An example of an NPS score (and not a good one)

Closed form on a SharePoint page

By accident I recently opened an old SharePoint News item in which we advertised a (now expired) series of webinars. I had embedded the Form to make it easy for people to enroll.

To my delighted surprise I saw the “this poll is closed” message from the Form displayed on the page. Neat!

Pretty neat, so people do not submit their entry in vain.

That text comes from the message that you can enter when you uncheck the box “Accept responses”, in Settings.

Useful extra option for informing your audience. This message will also be displayed if people click the link to the Form.

A new Forms landing page!

I knew that the Forms top bar would be replaced by the Office365 bar, but there have been more changes. Let me show you:

The top part of the new Forms landing page

The following changes have been made:

  • There’s a new, smaller, button to create a new Form (1). If you click the arrow, you can also create a new Quiz.
  • New title font.
  • The cards are landscape now, and smaller.
  • You land on “Recent Forms” which includes Forms that have been shared with you. This is quite nice as those are now easier to reach and they display the number of answers on the card.
  • Clicking the … on the card does NOT allow you to copy or delete the Form, you can only Pin it or remove it from this page.
  • You can Pin forms you want to keep on top; they will show in the Pinned Tab.
    Interestingly, the empty Pinned page says: “No pinned Office documents”. I know a Form is a document but it is just strange. I still do not know why my Forms are not in my OneDrive, if they are documents!
  • You have the option to show Forms in Tiles (cards) or in a list.
  • At the bottom right, just behind that “Feedback/Need Help” buttons there’s a link to All My Forms (2), which shows all your Forms.
  • If you scroll down, you will see a list of Groups with the number of Forms, if you have any.
The bottom part of the new landing page

If you click on “All My Forms” you will get to a page where you can click the … (which is now next to the title, instead of top right on the card) where you can Open in Browser, Move, Copy or Delete your Form. Next to that you will see the Deleted Forms tab.

The “My Forms” page

The Forms themselves have not changed – you will see the green Forms bar when you open or create a Form, and Theme, Sharing or Settings are still what they were.

But the behaviour has changed – Forms no longer opens in a new window from your Office365 landing page. I do not like that, I prefer to have my Office365 landing page always available.

Other than that, I am quite happy with these changes, especially the integration with Shared Forms. I was grumbling when I saw it at work, though, as I had just renewed my Forms webinar deck the day before and now I have to do it again!!! 😭

It’s a Poll! It’s an email! It’s a Form!

Forms may not be as hip as Teams at the moment, but it sure is a cool tool, sometimes even cooler than I thought!

Something relatively new is the option to add a Poll in an email. It is a nice option to quickly add a Choice question to your message. There is some support information out there but let me show you the full picture.

1. Create and send

When you open a new email and click on the … on the bottom of the mail (in the toolbar) you will see an option called “Poll”.

Click on the bottom of the new mail for the option to insert a poll

Click that and you will get a sidepane with a Choice question.

Enter your question and answer

Enter question and response options and click “Insert Poll into email”.

The poll will be inserted in the mail; the title of your question will be the subject line of your email (you can change that) and in the email body and you are added in the cc. If you change the name of the poll before you send it updates in both places! 💪

This is the email; you will get title and the link to the poll, but you can add explanatory text.

You can now type the rest of your mail and send it to your audience.

TIP: If you want to have that poll option always available in your toolbar just click the gear wheel top right > View all Outlook settings > Email > Customise actions and then scroll down to Toolbar. Check the Poll box and Save.

How to make the Poll-icon always visible at the bottom of your mails

2. Receive

So what happens when you receive an email?
The question will be displayed on top of the mail, with the options visible. This makes it easy to respond, but if you have many options in your answer, you will need to scroll to see the rest of the email.

You can see all options and vote immediately

When you have cast your vote, you will immediately see the result. You do not have to reply as your vote has been saved.

You can see if you have picked a day that others selected as well

If you happen to click the “View/vote in browser” link you will be taken to the Form in its regular format.

3. View results in email

As an owner, you can view the results from that mail. That’s why you are in the CC!

4. View results in Forms

The sender of the email is the owner of the Form, and when they go to their Forms page, they will see the Form with a poll-icon to distinguish it from a regular Form.

You can see this is an in-email poll by the poll icon

If you open it, you will see a message that you can not edit the poll.

Apparently this is called a Quick Poll and it is read-only

Limitations

  • You can only add one question
  • You can only add a Choice-type question
  • You can not edit the Form on your Forms page
  • Everyone sees the results immediately – that may be good or bad, just be aware.
  • People may forget to scroll down to see the rest of the mail 😁
  • According to the support information, this should not work well with people outside your organization, but it worked perfectly well between my Microsoft365 and private Outlook or Gmail accounts.

I can imagine this could be a good option for a quick question, without having to go and create a complete Form with all the trimmings.

Most of all, I like the integration of Forms and Outlook. It is smooth, clever and elegant.

It is also available in the Outlook desktop app but I am no fan of that.

Have you used it yet? And have you encountered a scenario where it did not work with “externals”? Let me know!

More about Forms

New icon!

FormsHave you noticed that Forms has a new icon? I have been unable to get a good large file but here’s a screenshot from my tenant.
Planner and To Do have new icons as well.

Comparison of Forms and Forms Pro

Megan V. Walker has recently created an excellent comparison of Forms vs. Forms Pro.  Apart from more options in the typeface part, you have more options to integrate data from other Office365 applications.
However, the licensing cost for Forms Pro is quite high in my opinion, so I will try to guide people to the regular Forms as much as possible.
A few colleagues had the Forms Pro Free Trial and they experienced issues when their trial expired. Once I removed the Pro Free license from their accounts, all worked well again, except that your Forms created in Pro are no longer accessible. Any results you captured, are still available. Be aware!

Check out Megan’s blog as she has tons more info on Forms and Forms Pro.

I do not think anyone will ever create a SharePoint survey any more 😦 , but if you are still interested, or want to know how if Forms is a good replacement for SurveyMonkey or GoogleForms, here’s my earlier comparison of survey tools:

Forms or survey – that’s the question (on the question/answer types)

Forms or survey – what are the settings? (on the general settings)

Forms or survey – responses and results (on the way responses are shown and general opinion)

And a beauty contest!

Some months ago I shared an invitation to a farewell party in our Yammer group, as an example of Forms. It was to invite internal and external attendees and ask them for their attendance and dietary preferences. I had helped the organizer create it, and he got it immediately and included some lovely pictures.

This was the start of an informal “contest” in my organization on who can create the best-looking form. 🙂
One of my colleagues no longer sends Outlook invitations for large meetings, but creates a nice-looking Form, which means she gets fewer emails and has all responses in a tidy Excel sheet.  I guess the receivers are pleasantly surprised by a nice-looking invite rather than a plain Outlook one.
Another colleague is carefully matching images and colours in her themes, and has even added a link to a hexcode website to her browser favourites!
I wonder if they are now thinking up new events just to be able to create a great-looking Form for it! 🙂
I freqently get calls where people mention “this person has created a beautiful survey and now I want one as well – how do I do that”.
And if all goes well we may replace a third-party application with a simple Form in the next few months. Fingers crossed!

This all delights me as I am working in a health care organization and most colleagues have different priorities than sitting at a desk at a computer.

(Something similar is happening with the SharePoint modern pages by the way, which is another pleasant surprise. More about that later)

So, invitations for larger meetings appear to be THE Forms application in my organization. What’s your number one scenario for Forms?

Photos and Forms

fotoform-header

You can create really good looking surveys with Microsoft Forms these days, just by using colours and images.

There are 4 places to add an image:

1. Background

You can use a standard theme, which will add a predetermined background image (optional) and colour scheme to your Form.
If you want to use your own theme, click Theme and then the +. This will open a screen allowing you to upload an image and/or set a background colour for texts and buttons.

Formfoto-theme
You can upload a picture and change the colour here. Try #ff0000 and see what happens!

2. Forms title

You can add a small image to the title and introduction text of your form.

3. Question

You can add an image to a question. You can choose between small and large.

4. Section

If you want to create a new page for a new question or set of questions, you can use a section. A section header can also contain an image, large or small. It behaves like an image in a question.

Size requirements for images – a test

I recently received a question from one of my users, who wanted to know the size requirements for images in Forms. The background image she used turned out to be a bit blurry. Of course, and fortunately, you no longer have to use exact dimensions in Office 365, but not every size works well in every application, so I did some tests.

  • I photographed a few scenes with my iPhone, using square, landscape and portrait orientation. (4:3 aspect ratio except for the square of course)
  • I resized them using good old Paint, making a 50, 38, 25, 10 and 5% of the original. All images were 72 dpi.
  • Then I created a Form with 2 questions and one section.
  • I started with the 5% size and uploaded this image as background, as title, as question (large and small) and as section image.
  • Whenever the image displayed blurry, I repeated the exercise with the 10% and so on, until I had a good idea of what worked.

Results

  1. The background needs an image of at least 750 pixels wide, but 1000 is better.
    The orientation of the image (square, landscape or portrait) does not matter. The background focuses on the center of the picture.

    Formfoto-backgrooundportrait5
    With an image of 152 pixels wide, the background is extremely blurry.

    Formfoto-squarebackground.png
    With an image of 756 pixels wide, this background is acceptable.

    Formsfoto-landscapebackground
    A 1008-pixel wide background is really nice.
  2. In the title you can use an image as small as 150 pixels wide. It does not display a lot of detail, so you can get away with a small image.
    The height of the image display is fixed, and the orientation of the image does not matter much.
    Formfoto-squareheaderFormfoto-landscape header

    Formfoto-portrait-header
    3 examples of pictures in the title – the orientation (square, portrait, landscape) shows more variety than the picture quality.
  3.  If you use a small picture in your question or section, go for at least 150 px wide.
    Use landscape where possible, as it will keep your form shorter. Check out the differences in the screenshots with the background, above.
  4. For a large picture in a question or section, at least 400 pixels wide is best.
    Please note that landscape pictures cover the whole width of the forms, and the question is shown on top. This makes for a very nice image, but as it is blown up a lot compared to the other formats, you really need to make sure the image is sharp.
    If you use the same image in every section, you can create a nicely consistent experience. (But do not go overboard, every new section is a click!)

    Formfoto-diffsmallandlarge.png
    This is 152 pixels. The small picture  is OK but the large one is not.

    formfoto-squaresmallvslarge.png
    Again, 303 x 303 pixels is acceptable for a small picture but for a large one it is just not enough. And it is not even displayed on the whole width!

    Formfoto-landscapelarge
    The image in Question 2 is 404 x 303 pixels. It makes an acceptable picture, even in full width of the form. 

Suggestions:

  • Use landscape imagery where possible – it just displays nicer
  • Keep in mind that different purposes need different image sizes. If your image is too small, do not use it as background or the large image.
  • 150-400-750 is just a guideline – with a different aspect ratio in your photos and pictures, more dpi and different viewing screen size, you may find that other sizes work better for you. And perhaps you WANT the background to be a bit blurry!
  • More info about working with images in Forms

Header image by Peachpink on Pixabay.
“Photos and Forms” reminds me of “Diamonds and Pearls” by the late great Prince. 

Forms or Survey – responses and results

Survey-responsesconclusionIn two earlier blogs I compared the Question and Answer types and the General survey settings for 5 different survey tools:

  • Microsoft Forms
  • SharePoint survey
  • SharePoint custom list
  • SurveyMonkey free version
  • Google Forms

Now it is time to gather the responses and see how they are displayed and what you can do with them. It is quite a long read but there are many screenshots as well!

What to look out for?

  • How you can distribute the link to the survey
  • What the survey looks like when you respond
  • How the results are being displayed by default and if you can export them
  • What else you can do with the data

Distribution

All tools allow creating a link or sending an email with the link.

Forms has the additional option to add the form directly on a SharePoint page, which looks very inviting, especially if the survey contains only a few questions. Forms can also generate a QR code to take you to the survey.

Forms-distribution
Sharing options in Forms at the bottom, from left to right: Link, QR code, Embed, Email

The SharePoint survey and Custom List can be added as a web part on a SharePoint page, but they are not exactly inviting users to enter.

SurveyMonkey has many different ways to get responses.

Surveymonkey distribution
Next to link and email, SurveyMonkey offers more options to get responses.

Google Forms allows you to add the survey questions directly into an email, which is very convenient.

Google-distribute
In Google Forms, you can add the complete survey to the email body. That is very easy for the audience!

User Experience

Of course the user experience is very important. If your survey has a tiny typeface, or takes forever to load, people are not likely to complete it.

You can still check out and complete the surveys below, to have an idea of their look-and-feel. Remember: you do not have to add any real data.

Forms

SurveyMonkey  (will close after 100 responses – limitation of the free version)

Google Forms

I am sharing some screenshots of remarkable things.

The Net Promotor Score looks special:

Forms-NPS
The Net Promotor Score column. The image I added made the look-and-feel of the survey different, see David Lozzi’s blog: https://davidlozzi.com/2018/11/13/squeezing-a-little-more-formatting-out-of-microsoft-forms/

This is the SharePoint Survey, in case you had forgotten what it looks like 🙂

Forms-Surveyinput
The good old SharePoint survey.

And this is how you enter data into a SharePoint custom list: in the information pane on the right-hand side of the page, which feels a bit strange.

SurveyList-input
This is the regular input screen in any list for metadata etc.

Next to a rather large font size, SurveyMonkey has the option to create columns for answers, which I really like as they make good use of space:

SurveyMonkey-columns
Those columns are very good when you have many options to choose from.

SurveyMonkey-slider and reorder
I also like SurveyMonkey’s slider and the reordering options.

Google Forms has nothing special, but it looks solid and modern.

Responses

Thank you everyone who has responded to one of the surveys! This allows me to show some of the results graphs. This is what the various response pages look like:

Microsoft Forms:

Forms-response1
Survey information on top, as well as an option to export everything to Excel. “More details” opens up all responses for a particular question.

Forms-response2
Colourful graphical summary of the responses.

Forms-reponse3
The last part of the survey. Aha, the Net Promotor Score IS quite a special thing!

SharePoint Survey. I am sharing only part of the graphical summary as I guess you have seen it before and it is not very exciting. Now I remember how annoying that “multiple responses” question is – you need to re-score everything manually! 😦

SharePointSurveyResults
Graphical summary of the SharePoint survey. Limited options and that “multiple responses” summary is just not useful.

The SharePoint custom list has no graphical summary. You just see the responses as line items in a list.

SurveyMonkey has a very long page of results. All responses are shown with a scroll bar (see the first screenshot) or with a graphical summary first and then the individual responses below. For each chart, you can change the chart type.
I will only show a few screens.

surveymonkeyresults1
You can see how many people answered and skipped the question. Most recent responses are shown on top; a scroll bar shows all responses.

Surveymonkeyresults3
A question where a pie chart would have been more appropriate in my opinion. But…clicking the “customize” button top right will open a pane to change the chart type.

SurveyMonkeyresults2
The multiple-answer question. Looks good.

Surveymonkeyresults4
This is the question which allows you to move answers around.

Google Forms results look like this:

Googleformsresults1
Top of the results page. The green button top right allows an export to spreadsheet.

Googleformsresults2

Googleformsresults3
Useful graph of the multiple-choice-question.

Googleformsresults4

Googleformsresults5
Bottom of the results. The “Net Promotor Score” is displayed as any other result.

 Results

I have captured the results in the picture below. You can also view/download this as Excel.  Look at the “Responses and Results” tab. Please use and edit it, but I would appreciate if you would mention my name if you share it outside of your organization.

Legend:

  • Green/Yes: Available by default, although it may have different names
  • Orange: Available with a workaround
  • Red/No: Not available

Formsorsurvey-ResultSettingswithheader
Comparison of the response and results options for the various tools.

Conclusion

Again, the classic SharePoint options are in a league of their own.

Microsoft Forms appears to have more in common with SurveyMonkey Free and Google Forms than with SharePoint. All three surveys are pleasant to complete and the graphical display of results is much better than with the SharePoint survey.

Overall conclusion

Forms is really the new way to conduct surveys in your organization and possibly with externals. It looks pleasant both on a SharePoint page and when completing it, it has a ton of good options, decent colourful graphs and it works with Flow.
Some people will really like that Net Promoter Score 🙂
I am sure that Forms will continue to develop, so I will try to keep this comparison up-to-date.

The SharePoint survey feels a tad outdated, although you can still conduct good surveys with it. The graphical summary is very inferior to what Forms has to offer. My suggestion would be to use this only when you need one of the more advanced Q & A options, such as selecting a name from someone in your organization. The whole permissions management is also more complicated than with Forms, as described in my “SharePoint Survey lifecycle” blog.

The SharePoint custom list may not be the option that comes to mind first when you talk about a survey, but especially the options to process the data after collection can be the reason to use it. You can group and filter the entries just like any View and edit entries (e.g. mark an item as “Completed” or add a certain category). With the additional  column types and the connection with Flow this can be the tool of choice when collecting data from the organization is the starting point for a project or process.
There are no graphics by default, but PowerBI may be used if needed.
Many thanks to my former colleague Scott Lewis who pointed out the benefits of custom lists when combined with Forms and Flow.

SurveyMonkey is of course THE specialized tool for surveys. It has extensive help for your survey questions and many options. It is the only tool that can show columns of responses, which is nice to keep your survey compact. It allows you to change the chart type of the results if desired. However, the free version has a few annoying limitations and I personally find the “management” interface rather cluttered.
For large-scale complicated surveys where you need to analyze responses in-depth the paid version beats Microsoft Forms.

Google Forms is a solid modern tool. Apart from the “display form straight in an email” it does not have any remarkable features.

Hope this comparison is useful to you. Have I missed any that are important for you? Please let me know – also if it has helped to move your colleagues away from SurveyMonkey (free) or GoogleForms! 🙂

Image courtesy of Geralt on Pixabay

Forms or Survey – what are the settings?

Survey-SettingsIn my most recent blog I discussed the options for Questions and Answers in the various survey tools.

This time, I would like to take a look at the settings – what can you decide about your survey as a whole?

Which settings can you apply to your survey?

  • Permissions to create and manage a survey – can anyone do it or do you need special permissions? Can you hand a survey over to someone else?
  • Look and feel – can you use colours and add branding to the survey?
  • Who can respond and details about the responses.
  • How to start and stop collecting responses.
  • Custom thank-you message.
  • Whether you can easily copy your survey.

Where can you find the settings?

The settings in Forms can be found in the top right. The palette is for the theme, the … will lead you to the other settings.

Forms-wheresettings
The settings in Forms which will allow you to determine how your survey looks and works.

For the SharePoint survey/list you have some options in the Advanced Settings:

Forms-SPSurveyAdvanced
This is how to determine view-and-edit permissions for SharePoint Survey and List.

Forms-SPSurvey-GeneralSettings
This option is only available in the SharePoint Survey Settings under  “List name, description and navigation”.

For SurveyMonkey, you can find most of the settings in the “Design Survey” phase, with different options in the buttons on the left:

Forms-surveyMonkeywhere
In SurveyMonkey, the Design Survey link shows you the options available.

For Google Forms you look at the top right, where the palette will allow you to determine the look-and-feel and the gear wheel will show other settings to select:

Forms-gogglewhere
Where to find the settings in Google Forms.

Results

I have captured the results in the picture below. You can also view/download this as Excel. I have added this info as a separate tab in the same document as in my earlier post. You can use and edit it, but I would appreciate if you would mention my name if you share it outside of your organization.

Legend:

  • Green/Yes: Available by default, although it may have different names
  • Orange: Available with a workaround
  • Red/No: Not available

Formsorsurvey-ResultSettingswithheader
The comparison for the various settings available.

Conclusion

Again, all surveys have different options but the differences are relatively small between Microsoft Forms, Google Forms and SurveyMonkey.
SurveyMonkey has some interesting options, such as a limit on the number of responses, suggestions for questions, and the SurveyMonkey Genius which gives an estimated time to complete and suggestions for the setup of the survey. (Under “Preview and Score”)
The SharePoint options appear to be a different animal altogether. They have their uses though, as mentioned in my earlier post.

Special Thanks!

During the writing of this post some more info about Forms was made available:

Thanks to David Lozzi for blogging about changing the colour scheme of a Form, which I have done by accident without realizing its effect. 🙂
Thanks to Noah Sparks for sharing the info about a recently introduced option:  transferring ownership of a Form. 

Experience the surveys yourself! (and help me)

You can still check out and complete the surveys below, to have an idea of their look-and-feel. Please do not use real data, as I will use the inputs only for demonstrating how results will be displayed:

Forms

SurveyMonkey  (will close after 100 responses – limitation of the free version)

Google Forms

In my next post I will focus on collecting the responses and how results are being displayed.

Image courtesy of Geralt on Pixabay.

Forms or Survey – that’s the question

feedbackA few years ago I wrote a post “What SharePoint can learn from SurveyMonkey” and it is now time to revisit.

With the introduction of Forms in Office365 I was curious how the various survey tools compare. As a SharePoint List can also be used to collect information, I have added that as well. It has some special characteristics that could make it a good choice in some scenarios.
I have some personal experience with Google Forms, and Forms is rumoured to be based on that, so I have added that to the mix as well.

So these are the 5 options compared:

  • Office365 Forms
  • SharePoint Survey
  • SharePoint List
  • SurveyMonkey (free version)
  • Google Forms

What did I do?

I have created a 10-question survey based on the 8 basic Q&A options of Forms.
Then I recreated the same survey in the other tools. In cases where there was not a straightforward solution, I tried to find a workaround.
I have not applied branching logic, as I already have a lot of information to share.

In a next post I will look at the general settings per survey. Can you change the colour scheme, can you add a logo, how do you start or stop a survey, etc.

Finally, and this will also be another post, I will compare the ways you can see and manage results. How are results displayed, can you export them to a spreadsheet, is there any way you can filter results or have different options to display them?

Questions and Answers

Forms has 8 Q and A types, but some of them can be used in different ways – e.g. a Choice question can be a one choice only (radio button) or a multiple choice (check boxes), and the Text can be a short text, a long text, and a number.

The Net Promoter Score has recently been added but I personally think it is superfluous (it can be replaced with a Rating scale) and also annoying to receive. However, there is something special about it which I will share later. 😉

Experience them yourself! (and help me)

Please check out and complete the surveys below, to have an idea of their look-and-feel. Please do not use real data, as I will use the inputs only for demonstrating how results will be displayed:

Forms

SurveyMonkey  (will close after 100 responses – limitation of the free version)

Google Forms

Results

I have captured the results in the picture below. You can also view/download this as Excel. You can use and edit it, but I would appreciate if you would mention my name if you share it outside of your organization.

Legend:

  • Green/Yes: Available by default, although it may have different names
  • Orange: Available with a workaround
  • Red/No: Not available

SurveyComparison-QandA
The results of the comparison of Question and Answers.

Conclusion

No two Survey tools are alike. Duh!

In general, the SharePoint options appear to be most different and the most limited, but they can be useful, especially when used within an organization, for which they have been developed:

  • They have more Q and A types (e.g. currency, People and Groups lookup, a lookup from an existing list, Managed Metadata) which may be needed now and then. The List also has Calculations and Site Columns to select from.
  • They can detect unique values, which is essential in case you are collecting unique numbers, such as machine, procedure or invoice numbers.

SurveyMonkey has a few annoying limitations in the free version, such as max. 10 questions, the lack of a “number” option or the absence of a description field for each question. But it also has some very nice things:

  • Add answer options in bulk to Choice questions – nice when you have many answer options
  • Display a large number of answer options in columns rather than a long list
  • Ask to “tick at least x options” in a multiple-choice question

There are some differences between Forms, SurveyMonkey and Google Forms. But in general, you can create decent survey questions with all of them.

What are your thoughts? Or do you prefer to wait until I have completed the comparison?

Image courtesy of Geralt on Pixabay.